The reason I write about DNA often, is because understanding our DNA is a very important aspect of being a Gnostic. A DNA test helps us find the long-lost history of our ancestors pasts, which then assists us in comprehending who we are and why we do the things we do.
My parents were French Canadian who thought they were just French. My father said that the original Bedards may have come to France by way of Germany. Never did I hear anyone in my family mention our Greek, Phoenician or Jewish ancestors. They all just assumed that our Catholic family had come to North America by way of France, then to Canada, and finally arriving here in the United States. However, now with the advent of DNA science and the Genome Project, this Bedard (me) can change hundreds of years of family ignorance into ancestral wisdom with just a little blog.
The facts are that our ancestors live on in our own blood. The rewriting of history and centuries of propaganda cannot change this DNA reality.
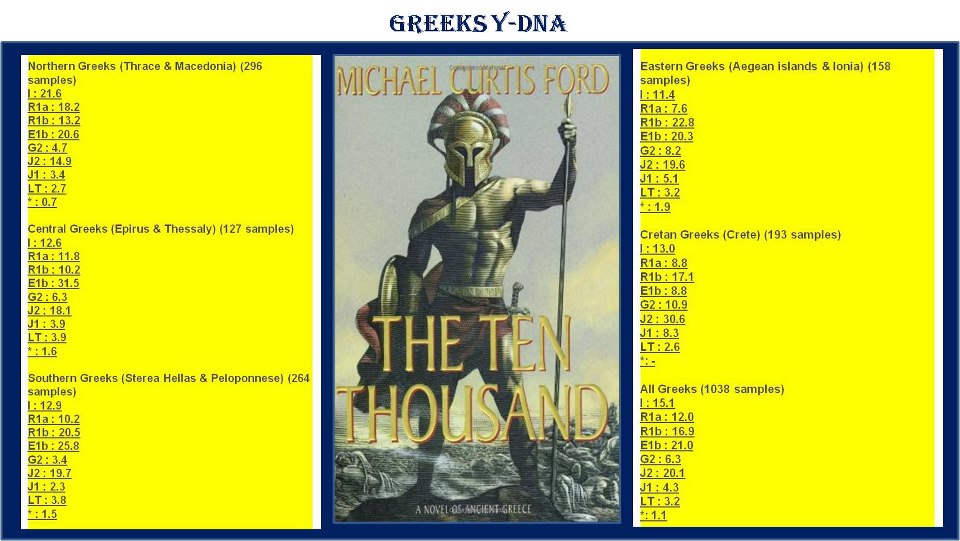
Highest contrast: E1b1b samples the highest at 31.5% in C. Greece & the lowest in Crete E1b1b 8.8%; this alone moves E1b1b at least 5%, because it effected the frequencies of other regions that are much higher than 8.8%, especially that none of the sample had 45% peak samples to reduce the 8.8% in Crete!
E1b1b (+5) ————26%
Moderate contrast: R1b is the lowest in Central Greece at 10.2% & slightly above average in Crete at 17.1%; this sampling disparity should be represented by a 1.5% point adjustment
R1b (-1.5) ———— 14%
J2, J1 & G2 also peak in Greece, but those have moderate effect
J2 (-2) ————— 21%
J1 composite was 5% goes down to 3% (which is already there)
G2 (-0.5)———— 6.5%
LT is 4.5% on the table, but all studies samples are under 4%, so it should be
LT (-1)—————-3.5%
SOURCES:
Sure
1.The Genetic Legacy of Paleolithic Homo sapiens sapiens in Extant Europeans: A
Y Chromosome Perspective (Semino et.al) 2000
2.Paternal and maternal lineages in the Balkans show a homogeneous landscape over linguistic barriers, except for the isolated Aromuns (Bosch et.al) 2005
3.Y-chromosomal evidence of the cultural diffusion of agriculture in southeast Europe (Battaglia et.al) 2008
4.Y-chromosomal evidence for a limited Greek contribution to the Pathan population of Pakistan (Firasat et.al) 2007
5.Clinal patterns of human Y chromosomal diversity in continental Italy and Greece are dominated by drift and founder effects (Di Giaccomo et.al) 2003
6.The coming of the Greeks to Provence and Corsica: Y-chromosome models of archaic Greek colonization of the western Mediterranean (King et.al) 2011
7. Differential Y-chromosome Anatolian Influences on the Greek and Cretan Neolithic (King et.al) 2008
8. Eupedia
Moe is the founder of GnosticWarrior.com. He is a father, husband, author, martial arts black belt, and an expert in Gnosticism, the occult, and esotericism.
Noah is not described in the Bible as a race of the Nephilim. If so lay the verse out. The Bible does very well on listing the generations of those who begat and their lineages. Most of what you say about your ancient connections to peoples in Israel is far fetched, and your knowledge on who the 12 tribes of Israel are, is fleeting or misleading. The Bible clearly describes God’s Chosen as a people who are consistently rebellious. Therefore they lost in the meantime their inheritance and the blessings as stated from Isaac. They would also lose their identity with help of the nations And other ethnic groups that became confederate and conspired to hide this identity. Psalms 83:5. Also a Jew is fro the loins of Judah. Judah is one family tree of the 12 tribes of Israel so to call the others Jews would be a slap in the face of the other 11 families paternal lineage considering that each family has a special and unique spiritual function and blessing in the kingdom God has promised them. But one glaring omission, the Bible says the people of God would possess their captors as slaves when they return to the promise land. I didn’t see any of these so-called jews in the modern definition of a Jew. Take any of their captors to serve them. No nazi slaves,no Egyptian slaves or Assyrian or Babylonian slaves. Why? Revelation 2:9. Explain that.
Y DNA E is African and Y DNA E1B1B is Afro-Asiatic.People who are of European origin and carry Y DNA E could have gotten it from the Natufian,Carthage or Egyptian mixing with Hellenic Greeks therefore developing E-v13 outside of Africa (the only haplotype of E that is known to develop outside of Africa)
I belong to the same clade E1b1b1c. However, I’m almost pure Ashkenazi, descended mostly from Jews from Saxony. One of the founding families of the Ashkenazi was that of the Kalonymus family. Scholarly opinion has always advocated that this family originated in Lucca, Italy but I’ve concluded that this was actually a family of Maniote (Spartan) Jews whose name was originally Cleonymus and were ultimately connected to a Boethan community.
E1 is a Mediterranean haplotype, not specifically Jewish. A number of individuals prominent in the NT were connected to Sparta, in particular Felix Antonius and his brother Marcus Antonius Pallas. According to Tacitus, they claimed to be descendant from the kings of Arcadia. Felix also married into the Herodian family (Drusilla), the daughter of Herod Agrippa I: to do so he must have been circumcised and therefore was most likely Jewish. Josephus tells us that one of Herod the Great’s wives was named Pallas: perhaps there is a connection between this marriage alliance and Felix. Felix was raised in the household of Antonia Minor, a daughter of Mark Anthony who had close social relations with the Jews of Egypt also.
The Kalonymus family is closely associated with Jewish mysticism and was purportedly a founding family of the Chassidei Ashkenaz (חסידי אשכנז “German Pietists”), a purported 10th century Jewish mystical movement in Germany.
The Maniote Jews–now subordinated to the Sephardi who fled to Ottoman domains in the 15th century–were also closely associated in Byzantine times with Jewish mysticism. I think the one most likely derives from the other. Sparta would have been a natural refuge for Hellenized Jews during late Antiquity, so if one were to look for a likely interface between Gnosticism, Neo-Platonism, and Judaism, it would be natural to look towards the Maniotes.
A 13th century descendant of the Kalonymus family was Ashur ben Jehiel, a prominent rabbi who fled Germany for Spain. Jehiel is also the name of a member of the same family who was prominent in Normandy in the 10th century. It also happens to be a name found in my own family. A so-called kinnui (secular) name corresponding to Ashur is Lamm (English “Lamb”), which in Low German is Lomm, also the name of a village now within the city limits of Venlo in Dutch Limburg. An alternative spelling for Lomm is “Lom”, also the transcribed form of my own family name from Russia.
I’ve discovered that my ancestral lines are closely connected to the orthodox congregation formed by Samson Raphael Hirsch in Frankfurt-on-Main in Germany in the 19th century and migrated to the Russian Pale of Settlement as part of an effort to evangelize his teachings among the Jews.
From all of this I conclude that there is a link between Ashkenazi Levite Jews of haplotype E1b and the Maniote Jews of late Antiquity and therefore also of Boethan gnostics.
Thanks for your comment. I’m VERY impressed with your wisdom and knowledge you have shared with us here on the Gnostic Warrior. I believe your assessment is pretty spot on. Let me please add to your comment my thoughts, connections and Gnosis.
The Boetians and Sparti were the descendants of the Phoenician Prince Cadmus and this makes them Phoenicians. The name Arcadia is just another name for the territory of the Phoenicians who went by many names such as the Arcadians. The meaning of the name Arcadia is the children of the ark. They were described as the people who survived the deluge and settled in various parts of the world such as Crete, Rhodes, North America, Sicily, Malta, Italy as the Umbrians and England as the Northumbrians and Celts.
For example, you mention Mark Antony and Antony was awarded the island of Crete by Caesar. The Jews are from Mount Ida on Crete and who the Roman-Jewish historian Josephus called the Idumeans which later became the Judeans and Tribe of Judah. Hence, the Arcadians who were the descendants of Israel and children of the ark. The name ark is a Hittite word for contract and this contract was the result of the union in souls that created the race of the Phoenicians from the Egyptians and Hittites who intermarried and created the race of the Phoenicians, AKA Arcadians, Minoans, Cretans, Israelites etc.
The name Crete is where we get the word create and it is well known that Western Civilization was birthed on Crete that was also known as Minoan and the people, the Minoans. A name that means the children of Jupiter.
Many of the Greeks, Germans, American Indians, modern Jews etc. are descendants of the Phoenicians.
The word Gnosis is derived from This ancient city is called “Knossos (/ˈnɒsəs/; also spelled Knossus, Cnossus, Greek Κνωσός, pronounced [knoˈsos] ), This was an actual city of Crete that is one of the most ancient in the world. The original Gnostics come from Crete and their learning center and library was at Knossus which is the original and oldest of them all.
The meaning of the Old Latin word ‘GNOsoo,’ is where we get the modern spellings of, “Knossos or Cnossos” and which have the same meaning as the Greek ‘Gnosis.’ In modern Latin, the g is substituted with the c or k. In Greek, the words “sus, sous” were various spellings for the modern spelling Zeus. In Latin, the meaning of sus was changed to mean “boar or pig.” Hence, the results of what I believe are the East/West schism. Let me also mention, that it is not far from the city of Knossos, on the side of Mount Ida, where the legend of the infant Zeus being hidden in an Idaean Cave by his mother Rhea originates. A cave that happens to be lying just above the Plain of Nida on Mount Ida, to the southwest of Knossos.
This is where the legend of Bull of Minos/ the Minotaur had originated in Cretan mythology. The Minotaur was a monster with the head of a bull and the body of a man who resided in a special type of building called a labyrinth, that was built at the City of Knossos. In later times, the Greeks had attributed the Minos myth to be the actual founder family of some of these cities on Crete. With their first king, Minos I,who was known as the “great lawgiver”, just like the biblical Moses was the equivalent of King Minos as the lawgiver to the Israelites. Minos is the son of Zeus and Europa, who him and his descendants were also said to be the founders of the first great thalassocracy, which refers to a state with primarily maritime realms—an empire at sea, such as the Phoenician network of merchant cities.
Hence, this would be the first true story of an organized Navy in the modern world that had originated under the leadership of the first kings of Crete. A people known in myth as the Minoans, and who we know today as the Phoenicians, Sea Peoples, and later the Ancient Greeks.
READ Below as of why it is argued that relatively small populations and the very non mixed of…Saami (Norway, Sweden, finish), Sardinians (Sardinia, very south of Mediterranean Dalmatia), Basques (North Spain) and Kosovar Albanians (Republic of Kosovo) are the very NATIVES of the European region.
I may hypothesize based on the DNA data below that “Illyrians are direct descendants of I2a”, however, I may also hypothesize (based on DNA data and the current ethnic locations of modern Albanians and Greeks) that modern Greeks are not the only descendants of Ancient Greeks but it comprises of other ancient tribes as follows. Arvanitas based on Southwest Greece (Arberesh, who spoke a dialect of the Albanian language). It is also argued that Arvanitas were also on Peloponnese area of Greece. Epirus (Where Gjergj Kastrioti Skanderbeg declared that he is a descendant of Epirus king of Pyrrhus), Dardania (current Kosovo) and the rest of the current Albania.
If we carefully look at the map and the highest percentages of E-V13, We can see that on the most areas where current ethnic Albanians live E-V13 has its highest percentages, Kosovo 47.5%, Albanians from Macedonia 39.1%, south Greece 43.5%, north Greece 35.4%, Arvanitas and Peloponnese area 47%%, and Albania with 27.5%. While the rest of the Greece (were traditionally is known that no Albanians live there) as of those from Crete have only 8.8%, Thrace 19%, and the rest of Greece overall, probably ethnic Greeks have only 19%, it also shows that they are much more Slavicized than Albanians with R1a 16% and I2a of 19%. In addition, based on a map shown with a percentage of E-V13, south Serbia (were ethnic Albanians live) has higher percentage of E-V13, and south east and north east part of Montenegro (were ethnic Albanians live) have also higher percentage.
Autosomal DNA[edit]
Analysis of autosomal DNA, which analyses all genetic components has revealed that few genetic discontinuities exist in European populations, apart from certain outliers such as Saami, Sardinians, Basques and Kosovar Albanians. They found that Albanians, on the one hand, have a high amount of identity by descent sharing, suggesting that both Albanians from Albania and Kosovo derived from a relatively small population that expanded recently and rapidly in the last 1,500 years. On the other hand, they are not wholly isolated or endogamous, as they share a significant amount of descent with nearby Macedonian, Greek and Italian populations.[103]The recent growth is particularly evident in Kosovar Albanians, which show particularly high levels of homogeneity, in contrast to the diversity otherwise found in other Balkan populations.[104] http://arxiv.org/pdf/1207.3815v1.pdf
Novembre J. et al. (2008) Genes mirror geography within Europe, Nature doi:10.1038/nature07331
R1b (kelts, 22,000 years BC) J2 (middle-east 15,000 years BC) I1 (Vikings Scandinavians 20,000 years BC) R1a (Slavs – Russia, Poland 22,000 years BC) I2a (Sardinia, Dalmatia 8,000 years BC). E (54,000 years BC), E1b1b (42,000 years BC). E-V13 (10,000 years BC)
Y haplogroup E1b1b (E-M35) in the modern Balkan population is dominated by its sub-clade E1b1b1a (E-M78) and specifically by the most common European sub-clade of E-M78, E-V13.[68] The area in and around Albanian speaking regions has the highest known percentages E-V13 in the world, and it is thought that the majority of E-V13 in Europe and elsewhere descend from a common ancestor who lived in the Balkans in the late Mesolithic or Neolithic, and that men of this lineage began to spread outside the Balkans as early as the Neolithic, or even as recently as the Roman era.[68][69][70][71][72][73]
It is argued that Greeks Conquer Minoans (1450 BC) and authors therefore conclude that the Minoan civilization was a local development, originated by inhabitants who probably reached the island around 9,000 years ago. More research is needed to verify if the ethnic Albanians and Greeks are descendants of Minoans. Or it would be possible too when ancient Greeks conquered Minoans they might have came from some other region, as data shows they might have been I2a, R1a, J2 or even R1b.
Ok we all get you are smart. So what do you think the DNA of the beings called angels across cultures would be? Could you test it? What of the nephlim? What would there DNA be? just wondering what you think
My purpose is not to appear smart, but to share knowledge with like minded people and correct history where needed be. The beings called angels across cultures would be of the same DNA since these are the same people, tribe and race who wrote both the Old and New Testaments that mention these angles, sons of God or Nephilim. Both the Old and New Testaments were originally written in Greek and not Hebrew which is really Phoenician. Yes, I AM doing the testing on this blog, a future book and also with the help of DNA science that will help document their migrations across the world.
This post would help represent the DNA of the 12 Tribes of Israel that all come from the same Nephilim family tree.
Here is some supporting research:
Ossuaries dating from the Second Temple period indicate Greek artwork and Greek versions of Hebrew names. In Biblical Archaeological Review, Pieter W. Van Der Horst writes, “One of the most surprising facts about funerary inscriptions [extant from ancient Palestine dating from 300 B.C. to 500 A.D] is that most of them are in Greek – approximately 70 percent; about 12 percent are in Latin; and only 18 percent are in Hebrew or Aramaic.” Furthermore, since the time of Alexander the Great (c. 330 B.C), many of the Jewish High Priests had become “Hellenists” which led to the rejection of the Temple by the Essene Community and eventually to the later Maccabean revolts. Even the Dead Sea Scrolls include Greek texts among the Hebrew and Aramaic. So it’s clear that Hellenistic culture and Greek language were pervasive influences in Israel both before, during, and after the time when Yeshua lived in ancient Israel.


Noah is not described in the Bible as a race of the Nephilim. If so lay the verse out. The Bible does very well on listing the generations of those who begat and their lineages. Most of what you say about your ancient connections to peoples in Israel is far fetched, and your knowledge on who the 12 tribes of Israel are, is fleeting or misleading. The Bible clearly describes God’s Chosen as a people who are consistently rebellious. Therefore they lost in the meantime their inheritance and the blessings as stated from Isaac. They would also lose their identity with help of the nations And other ethnic groups that became confederate and conspired to hide this identity. Psalms 83:5. Also a Jew is fro the loins of Judah. Judah is one family tree of the 12 tribes of Israel so to call the others Jews would be a slap in the face of the other 11 families paternal lineage considering that each family has a special and unique spiritual function and blessing in the kingdom God has promised them. But one glaring omission, the Bible says the people of God would possess their captors as slaves when they return to the promise land. I didn’t see any of these so-called jews in the modern definition of a Jew. Take any of their captors to serve them. No nazi slaves,no Egyptian slaves or Assyrian or Babylonian slaves. Why? Revelation 2:9. Explain that.
Y DNA E is African and Y DNA E1B1B is Afro-Asiatic.People who are of European origin and carry Y DNA E could have gotten it from the Natufian,Carthage or Egyptian mixing with Hellenic Greeks therefore developing E-v13 outside of Africa (the only haplotype of E that is known to develop outside of Africa)
I belong to the same clade E1b1b1c. However, I’m almost pure Ashkenazi, descended mostly from Jews from Saxony. One of the founding families of the Ashkenazi was that of the Kalonymus family. Scholarly opinion has always advocated that this family originated in Lucca, Italy but I’ve concluded that this was actually a family of Maniote (Spartan) Jews whose name was originally Cleonymus and were ultimately connected to a Boethan community.
E1 is a Mediterranean haplotype, not specifically Jewish. A number of individuals prominent in the NT were connected to Sparta, in particular Felix Antonius and his brother Marcus Antonius Pallas. According to Tacitus, they claimed to be descendant from the kings of Arcadia. Felix also married into the Herodian family (Drusilla), the daughter of Herod Agrippa I: to do so he must have been circumcised and therefore was most likely Jewish. Josephus tells us that one of Herod the Great’s wives was named Pallas: perhaps there is a connection between this marriage alliance and Felix. Felix was raised in the household of Antonia Minor, a daughter of Mark Anthony who had close social relations with the Jews of Egypt also.
The Kalonymus family is closely associated with Jewish mysticism and was purportedly a founding family of the Chassidei Ashkenaz (חסידי אשכנז “German Pietists”), a purported 10th century Jewish mystical movement in Germany.
The Maniote Jews–now subordinated to the Sephardi who fled to Ottoman domains in the 15th century–were also closely associated in Byzantine times with Jewish mysticism. I think the one most likely derives from the other. Sparta would have been a natural refuge for Hellenized Jews during late Antiquity, so if one were to look for a likely interface between Gnosticism, Neo-Platonism, and Judaism, it would be natural to look towards the Maniotes.
A 13th century descendant of the Kalonymus family was Ashur ben Jehiel, a prominent rabbi who fled Germany for Spain. Jehiel is also the name of a member of the same family who was prominent in Normandy in the 10th century. It also happens to be a name found in my own family. A so-called kinnui (secular) name corresponding to Ashur is Lamm (English “Lamb”), which in Low German is Lomm, also the name of a village now within the city limits of Venlo in Dutch Limburg. An alternative spelling for Lomm is “Lom”, also the transcribed form of my own family name from Russia.
I’ve discovered that my ancestral lines are closely connected to the orthodox congregation formed by Samson Raphael Hirsch in Frankfurt-on-Main in Germany in the 19th century and migrated to the Russian Pale of Settlement as part of an effort to evangelize his teachings among the Jews.
From all of this I conclude that there is a link between Ashkenazi Levite Jews of haplotype E1b and the Maniote Jews of late Antiquity and therefore also of Boethan gnostics.
Thanks for your comment. I’m VERY impressed with your wisdom and knowledge you have shared with us here on the Gnostic Warrior. I believe your assessment is pretty spot on. Let me please add to your comment my thoughts, connections and Gnosis.
The Boetians and Sparti were the descendants of the Phoenician Prince Cadmus and this makes them Phoenicians. The name Arcadia is just another name for the territory of the Phoenicians who went by many names such as the Arcadians. The meaning of the name Arcadia is the children of the ark. They were described as the people who survived the deluge and settled in various parts of the world such as Crete, Rhodes, North America, Sicily, Malta, Italy as the Umbrians and England as the Northumbrians and Celts.
For example, you mention Mark Antony and Antony was awarded the island of Crete by Caesar. The Jews are from Mount Ida on Crete and who the Roman-Jewish historian Josephus called the Idumeans which later became the Judeans and Tribe of Judah. Hence, the Arcadians who were the descendants of Israel and children of the ark. The name ark is a Hittite word for contract and this contract was the result of the union in souls that created the race of the Phoenicians from the Egyptians and Hittites who intermarried and created the race of the Phoenicians, AKA Arcadians, Minoans, Cretans, Israelites etc.
The name Crete is where we get the word create and it is well known that Western Civilization was birthed on Crete that was also known as Minoan and the people, the Minoans. A name that means the children of Jupiter.
Many of the Greeks, Germans, American Indians, modern Jews etc. are descendants of the Phoenicians.
The word Gnosis is derived from This ancient city is called “Knossos (/ˈnɒsəs/; also spelled Knossus, Cnossus, Greek Κνωσός, pronounced [knoˈsos] ), This was an actual city of Crete that is one of the most ancient in the world. The original Gnostics come from Crete and their learning center and library was at Knossus which is the original and oldest of them all.
The meaning of the Old Latin word ‘GNOsoo,’ is where we get the modern spellings of, “Knossos or Cnossos” and which have the same meaning as the Greek ‘Gnosis.’ In modern Latin, the g is substituted with the c or k. In Greek, the words “sus, sous” were various spellings for the modern spelling Zeus. In Latin, the meaning of sus was changed to mean “boar or pig.” Hence, the results of what I believe are the East/West schism. Let me also mention, that it is not far from the city of Knossos, on the side of Mount Ida, where the legend of the infant Zeus being hidden in an Idaean Cave by his mother Rhea originates. A cave that happens to be lying just above the Plain of Nida on Mount Ida, to the southwest of Knossos.
This is where the legend of Bull of Minos/ the Minotaur had originated in Cretan mythology. The Minotaur was a monster with the head of a bull and the body of a man who resided in a special type of building called a labyrinth, that was built at the City of Knossos. In later times, the Greeks had attributed the Minos myth to be the actual founder family of some of these cities on Crete. With their first king, Minos I,who was known as the “great lawgiver”, just like the biblical Moses was the equivalent of King Minos as the lawgiver to the Israelites. Minos is the son of Zeus and Europa, who him and his descendants were also said to be the founders of the first great thalassocracy, which refers to a state with primarily maritime realms—an empire at sea, such as the Phoenician network of merchant cities.
Hence, this would be the first true story of an organized Navy in the modern world that had originated under the leadership of the first kings of Crete. A people known in myth as the Minoans, and who we know today as the Phoenicians, Sea Peoples, and later the Ancient Greeks.
Well done Art! That should be the truth.
READ Below as of why it is argued that relatively small populations and the very non mixed of…Saami (Norway, Sweden, finish), Sardinians (Sardinia, very south of Mediterranean Dalmatia), Basques (North Spain) and Kosovar Albanians (Republic of Kosovo) are the very NATIVES of the European region.
I may hypothesize based on the DNA data below that “Illyrians are direct descendants of I2a”, however, I may also hypothesize (based on DNA data and the current ethnic locations of modern Albanians and Greeks) that modern Greeks are not the only descendants of Ancient Greeks but it comprises of other ancient tribes as follows. Arvanitas based on Southwest Greece (Arberesh, who spoke a dialect of the Albanian language). It is also argued that Arvanitas were also on Peloponnese area of Greece. Epirus (Where Gjergj Kastrioti Skanderbeg declared that he is a descendant of Epirus king of Pyrrhus), Dardania (current Kosovo) and the rest of the current Albania.
If we carefully look at the map and the highest percentages of E-V13, We can see that on the most areas where current ethnic Albanians live E-V13 has its highest percentages, Kosovo 47.5%, Albanians from Macedonia 39.1%, south Greece 43.5%, north Greece 35.4%, Arvanitas and Peloponnese area 47%%, and Albania with 27.5%. While the rest of the Greece (were traditionally is known that no Albanians live there) as of those from Crete have only 8.8%, Thrace 19%, and the rest of Greece overall, probably ethnic Greeks have only 19%, it also shows that they are much more Slavicized than Albanians with R1a 16% and I2a of 19%. In addition, based on a map shown with a percentage of E-V13, south Serbia (were ethnic Albanians live) has higher percentage of E-V13, and south east and north east part of Montenegro (were ethnic Albanians live) have also higher percentage.
If E-V13 is 10,000 years BC then can we argue that ethnic Albanians are NATIVE inhabitants of Europe, it should be interested to see what DNA would the kings of Ancient Greeks have.
This also verifies why Greek and Albanian language is 5000 years old as argued in the recent study.
http://www.nytimes.com/interactive/2012/08/24/science/0824-origins.html?ref=science&module=Search&mabReward=relbias%3Aw&_r=2&
Therefore it is argued that relatively small populations and the very non mixed of…Saami (Norway, Sweden, finish), Sardinians (Sardinia, very south of Mediterranean Dalmatia), Basques (North Spain) and Kosovar Albanians (Republic of Kosovo) are the very NATIVES of the European region.
Please refer to what native Saami, Sardinians, Basques and Kosovar Albanians should look alike
http://en.wikipedia.org/wiki/Sardinian_people
http://en.wikipedia.org/wiki/Basque_people
http://en.wikipedia.org/wiki/Sami_people
http://en.wikipedia.org/wiki/Albanians_in_Kosovo
Autosomal DNA[edit]
Analysis of autosomal DNA, which analyses all genetic components has revealed that few genetic discontinuities exist in European populations, apart from certain outliers such as Saami, Sardinians, Basques and Kosovar Albanians. They found that Albanians, on the one hand, have a high amount of identity by descent sharing, suggesting that both Albanians from Albania and Kosovo derived from a relatively small population that expanded recently and rapidly in the last 1,500 years. On the other hand, they are not wholly isolated or endogamous, as they share a significant amount of descent with nearby Macedonian, Greek and Italian populations.[103]The recent growth is particularly evident in Kosovar Albanians, which show particularly high levels of homogeneity, in contrast to the diversity otherwise found in other Balkan populations.[104]
http://arxiv.org/pdf/1207.3815v1.pdf
Novembre J. et al. (2008) Genes mirror geography within Europe, Nature doi:10.1038/nature07331
R1b (kelts, 22,000 years BC) J2 (middle-east 15,000 years BC) I1 (Vikings Scandinavians 20,000 years BC) R1a (Slavs – Russia, Poland 22,000 years BC) I2a (Sardinia, Dalmatia 8,000 years BC). E (54,000 years BC), E1b1b (42,000 years BC). E-V13 (10,000 years BC)
Region/Haplogroup I1 I2*/I2a I2b R1a R1b G J2 J*/J1 E-V13
Albania 2 12 1.5 9 1 6 1.5 19.5 2 27.5
Kosovo 5.5 2.5 0 4.5 21 0 16.5 0 47.5
Albanians (Macedonia) 1 9 1.5 18.8 1.6 21.9 39.1
Greece (Peloponnese) 47
Greece (South) 3 20 2.2 19.6 5.5 43.5
Greece (North) 2 12 18.8 14.6 5.2 35.4
Macedonia (ethnic Slavic) 33 1.5 5.1 15.2 1.5 24.1
Bulgaria 4 20 2 17 11 5 11 3 23.5
Bosniaks 4 56 0 16 3 2 3. 5 0.5 10
Bosnian Croats 0 71 2 12 2 1 1 0 9
Bosnian Serbs 2.5 31 2.5 13.5 6 1 8.5 0 22.5
Croatia 5.5 37 1 24 8.5 2.5 6 1 10
Serbia 8.5 33 0.5 16 8 2 8 0.5 18
Sardinia 0 37.5 2 1 18.5 12 9 4 9.5
Greece (Crete) 13.0 8.8 17.0 39 8.8
Greece (Thrace) 19 22 12.2 19 19
Greece (ethnic Greeks) 19 16 11.7 9 17 19
Montenegro 33 14 6.7 9 17 19
Y haplogroup E1b1b (E-M35) in the modern Balkan population is dominated by its sub-clade E1b1b1a (E-M78) and specifically by the most common European sub-clade of E-M78, E-V13.[68] The area in and around Albanian speaking regions has the highest known percentages E-V13 in the world, and it is thought that the majority of E-V13 in Europe and elsewhere descend from a common ancestor who lived in the Balkans in the late Mesolithic or Neolithic, and that men of this lineage began to spread outside the Balkans as early as the Neolithic, or even as recently as the Roman era.[68][69][70][71][72][73]
It is argued that Greeks Conquer Minoans (1450 BC) and authors therefore conclude that the Minoan civilization was a local development, originated by inhabitants who probably reached the island around 9,000 years ago. More research is needed to verify if the ethnic Albanians and Greeks are descendants of Minoans. Or it would be possible too when ancient Greeks conquered Minoans they might have came from some other region, as data shows they might have been I2a, R1a, J2 or even R1b.
References:
http://www.jogg.info/32/bird.htm
http://www.eupedia.com/europe/european_y-dna_haplogroups.shtml
http://www.eupedia.com/europe/Haplogroup_E1b1b_Y-DNA.shtml
http://en.wikipedia.org/wiki/Y-DNA_haplogroups_by_ethnic_group
https://www.youtube.com/watch?v=-Agawf3IRD4
https://www.youtube.com/watch?v=M99ze151HvA
http://en.wikipedia.org/wiki/Chaonians
Ok we all get you are smart. So what do you think the DNA of the beings called angels across cultures would be? Could you test it? What of the nephlim? What would there DNA be? just wondering what you think
My purpose is not to appear smart, but to share knowledge with like minded people and correct history where needed be. The beings called angels across cultures would be of the same DNA since these are the same people, tribe and race who wrote both the Old and New Testaments that mention these angles, sons of God or Nephilim. Both the Old and New Testaments were originally written in Greek and not Hebrew which is really Phoenician. Yes, I AM doing the testing on this blog, a future book and also with the help of DNA science that will help document their migrations across the world.
This post would help represent the DNA of the 12 Tribes of Israel that all come from the same Nephilim family tree.
Here is some supporting research:
Ossuaries dating from the Second Temple period indicate Greek artwork and Greek versions of Hebrew names. In Biblical Archaeological Review, Pieter W. Van Der Horst writes, “One of the most surprising facts about funerary inscriptions [extant from ancient Palestine dating from 300 B.C. to 500 A.D] is that most of them are in Greek – approximately 70 percent; about 12 percent are in Latin; and only 18 percent are in Hebrew or Aramaic.” Furthermore, since the time of Alexander the Great (c. 330 B.C), many of the Jewish High Priests had become “Hellenists” which led to the rejection of the Temple by the Essene Community and eventually to the later Maccabean revolts. Even the Dead Sea Scrolls include Greek texts among the Hebrew and Aramaic. So it’s clear that Hellenistic culture and Greek language were pervasive influences in Israel both before, during, and after the time when Yeshua lived in ancient Israel.
http://www.hebrew4christians.com/Articles/Jesus_Hebrew/Greek_NT/greek_nt.html